Power for delivery across the whole of 2027 now costs € 117.90 per MWh. At the start of August it was € 101.04. Gas for 2027 went from € 41.96 to € 52.29 over the same four weeks. Behind that rise sits mainly one figure: how little gas there is in European storage.

We like to keep you up to date on developments in the energy market. In August gas and power prices rose four weeks in a row, mainly because of low gas storage in Europe.
Dutch gas storage was 47.3 percent full on 31 August, against 64.8 percent on the same day last year. Until 1 November the underground storage sites are being filled for the winter. There is now more than a quarter less in them than last year, with two and a half months to go.
How full Dutch gas storage was, this year against last year. The gap with last year has grown since April, from sixteen percentage points to seventeen and a half.
In Europe too storage was low at the end of August: 65.4 percent, against 77.7 percent a year earlier. It had never been this low at the end of August in the sixteen years that Europe has kept track. Even 2021, the year in which prices then rose sharply, was slightly better off at 67.3 percent.
The European level on 31 August, for every year since 2015. In the good years there was well over ninety percent in storage. This year sits at the bottom of the entire series.
Gas that is not in storage on 1 November has to be bought in winter, when it is most expensive. In August an average of 0.48 billion kilowatt hours a day was added in the Netherlands, slightly less than in July. At that pace Dutch storage will go into winter at around 68 percent and European storage at around 82 percent. That is enough for a normal winter and too little for a cold one.
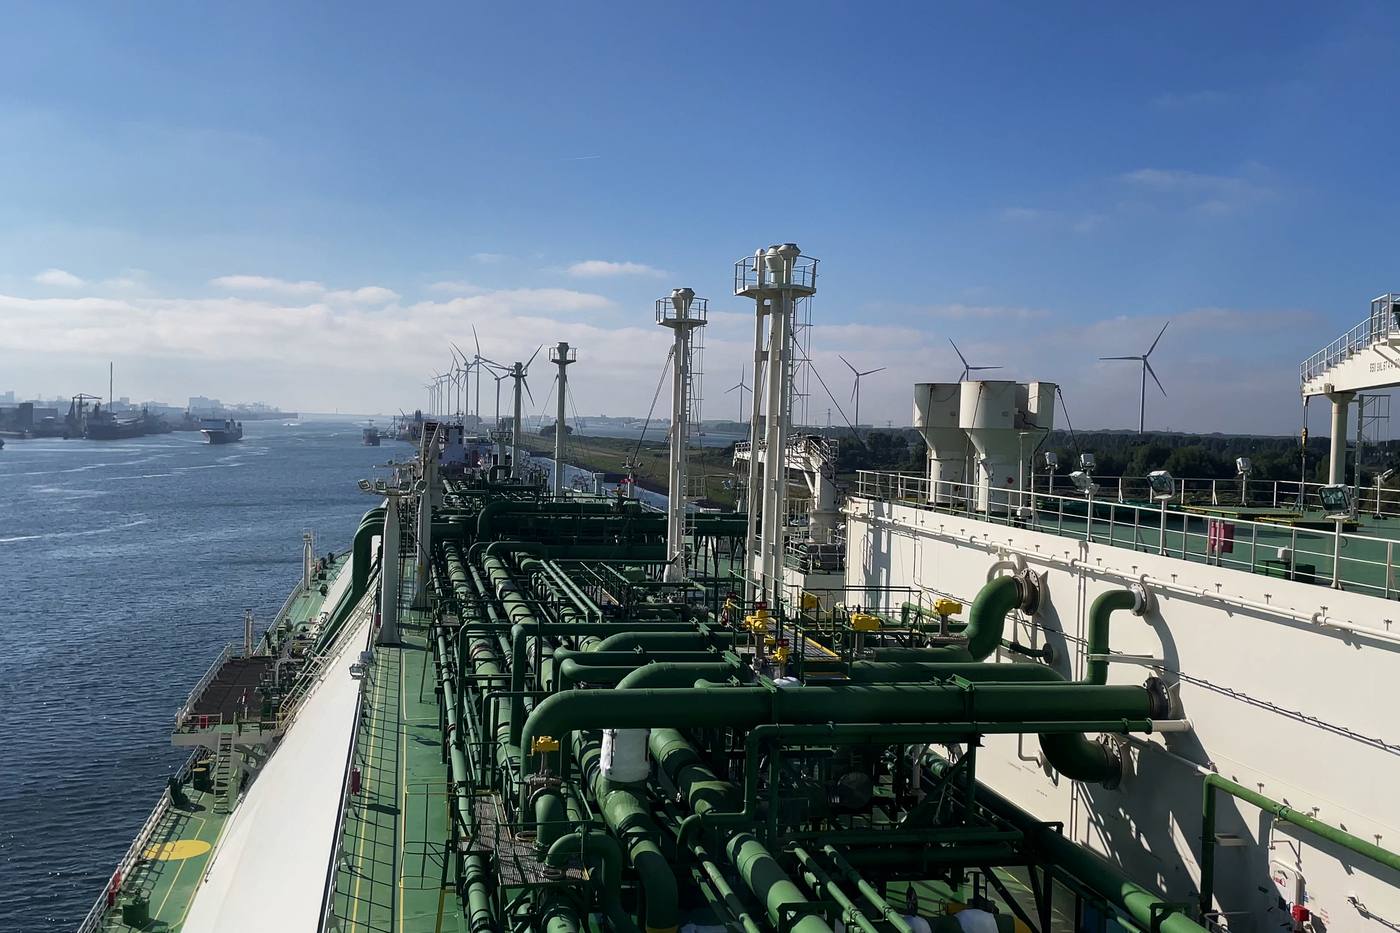
Europe fills its storage largely with LNG: natural gas cooled to 162 degrees below zero, which makes it liquid so it can be transported by ship. One of the largest suppliers is Qatar, and every LNG tanker that leaves there has to pass through the Strait of Hormuz, the strait between Iran and Oman. The United States and Iran are firing on each other there, and an oil tanker has struck a mine.
Oil tankers still pass through, six to eight million barrels a day against about twenty million before it became unsafe. LNG tankers stay away far more often. Liquefied gas can hardly be transferred to another ship on the way, and the global fleet of about nine hundred LNG tankers is too small for long detours. In addition, there was maintenance at a number of Norwegian gas installations in August, while Norway is Europe's largest supplier by pipeline.
At the same time supply is picking up slightly. Because gas is expensive in Europe, the ships that do sail prefer to unload here rather than in Asia. That slows the shortfall.
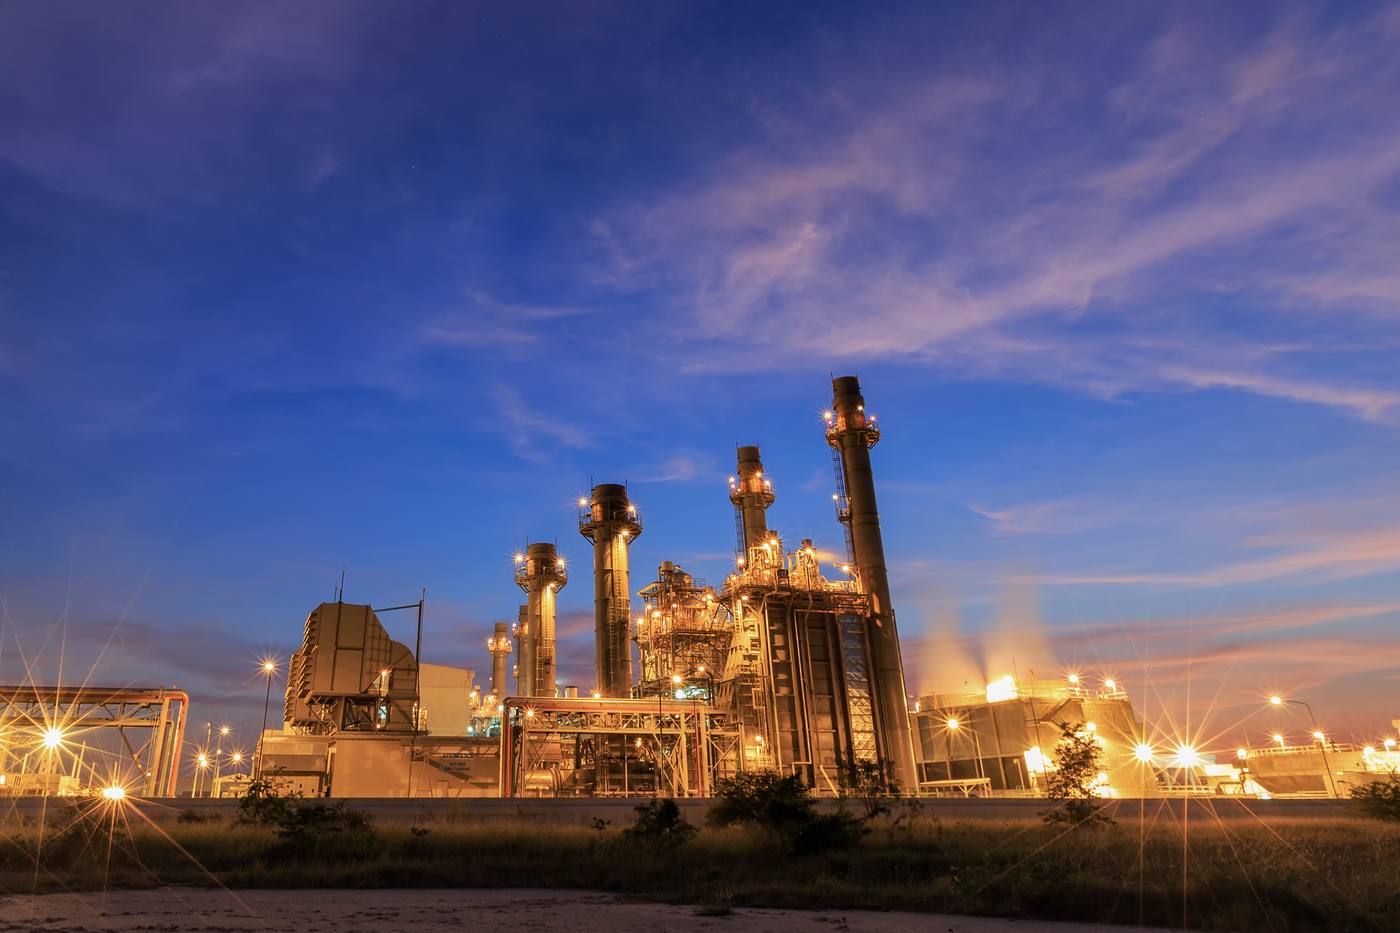
The Dutch power price averaged € 125.41 per MWh in August, against € 105.86 in July. Since the start of 2023 only January and February 2023 and February 2025 were more expensive. When gas is expensive, power from gas plants becomes expensive, and those plants were badly needed in August. Hydropower in the Alps produced little because of the drought, and the nuclear plants in France were not running at full capacity.
In the Netherlands it was mainly the coal plants that stepped in. They produced 1,577 gigawatt hours in August, against 885 in August last year, the most since 2022. Coal was cheaper than gas, even including the CO₂ allowances a plant has to buy for its emissions. As a result the gas plants here actually ran slightly less than last year.
What the Dutch coal fired power plants produced in August. After 2022 it dropped to almost nothing; this year it is back close to the level of the crisis years.
Across Europe coal and gas plants both ran more, 20 and 23 percent more than in August last year. Everything that could run had to run, and that kept the price high.
Within the day the differences were large. At one o'clock in the afternoon power cost an average of € 30.75 per MWh in August, at eight in the evening € 201.34. In 53 hours the price was negative: you were paid to use power. In 33 hours it was above € 200.
What a megawatt hour of power cost on average, by hour of the day. The midday dip comes from the sun, the evening peak from the moment the sun goes and everyone comes home.
With a fixed price you notice little of this. If you are on the price of the moment, or can shift production, you can make use of the difference of € 170 per MWh between afternoon and evening.
On the forward market, where energy for delivery in a later period is traded, prices have been rising for three weeks in a row since mid August, and ever faster. Power for the whole of 2027 now costs € 117.90 per MWh, against € 101.04 at the start of August. Gas for 2027 went from € 41.96 to € 52.29.
| Delivery in 2027 | 18 August | 25 August | 1 September | Change |
|---|---|---|---|---|
| Power | € 106.47 | € 111.95 | € 117.90 | +10.7 percent |
| Gas | € 45.39 | € 47.96 | € 52.29 | +15.2 percent |
Prices for delivery across the whole of 2027, in euros per megawatt hour, as they stood at the end of each week.
In three weeks € 11.43 per MWh was added to the power price for 2027 and € 6.90 to gas. For a business that takes 5,000 MWh of power a year, that is a difference of more than fifty thousand euros, just from the moment you sign.
| Delivery year | Power | Week | Peak hours | Week | Gas | Week |
|---|---|---|---|---|---|---|
| 2027 | 117,90 | +5,95 | 122,12 | +6,83 | 52,29 | +4,33 |
| 2028 | 91,85 | +2,64 | 96,15 | +3,18 | 34,30 | +2,19 |
| 2029 | 82,55 | +2,05 | 90,87 | +2,39 | 27,46 | +1,45 |
Prices per delivery year in euros per megawatt hour, with the change over the last week. The further out in time, the smaller the movement: 2029 gained just 1.45 on top.
The further out in time, the smaller the rise: power for 2029 costs € 82.55 per MWh. So the market expects the tightness to play out mainly next year. A contract that runs for longer spreads the expensive winter over years that the market itself rates lower.
We expect the price to rise rather than fall, as long as supply by ship keeps faltering. The biggest risk is in winter: with half-empty storage, a cold week in January feeds through into the price harder than normal. Anyone who fixes the price in parts ends up with an average instead of a gamble.
Would you like to know which purchasing moments you still have open, how your consumption is spread over the day or what a cold January does to your costs? Then get in touch with us. We will work it out for you, with your own figures.
Subscribe to our newsletter and never miss important news from the energy market.
We use your email address only for our newsletter and market updates. See our privacy statement.
We are happy to go through your energy situation with you and show you where the opportunities are. Free of charge and with no obligation.